The Next Industrial Advantage: Seeing the Losses Your Control System Cannot
Why plant engineers are pairing established automation with independent process measurements and AI—and why the economics extend far beyond energy savings.
Alexander Towfigh | Founder, AquaMesh
For major manufacturers, the cost of an undetected process problem can dwarf the price of the instrumentation intended to catch it. Siemens’ Senseye research estimated that unplanned downtime costs the world’s 500 largest companies nearly $1.4 trillion annually—about 11% of their combined revenue. That is a vendor-study estimate for very large enterprises, not a benchmark for every plant. The more actionable opportunity is at the facility level: combining existing automation data with independent physical measurements and process-aware AI could plausibly help recover 5–15% of *identified, addressable recurring losses* in product yield, material waste, chemical use and avoidable process interruptions—provided the problems are measurable and operators can act on the findings. At a plant with $10 million a year in such losses, that represents $500,000–$1.5 million in potential annual value. These are illustrative targets, not demonstrated savings or a percentage of total plant operating costs.
For a plant manager, the questions are practical: How much sellable product leaves through a drain? How often does variable feed chemistry force overdosing or rework? What is the financial impact of a slow-developing upset before a limit is breached? Which recurring losses are absent from the existing dashboard because no instrument measures the underlying physical condition? The next generation of industrial intelligence aims to answer these questions continuously, using the controls plants already trust.
Plants do not need another dashboard. They need earlier, better decisions.
PLCs, distributed control systems and SCADA have transformed industrial reliability. They execute deterministic logic, maintain setpoints, enforce interlocks and preserve the safe operation of critical equipment. Historians record what happened. None of those functions should be displaced.
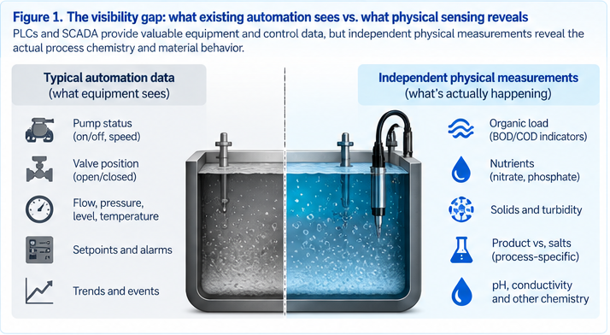
But a controller cannot reason about a variable it never measures. A flowmeter can report a stable flow while the composition of the stream changes. A conductivity probe can detect a shift without telling an operator whether it came from salt, cleaning solution or valuable product. A dissolved-oxygen signal may be accurate, fouled or simply insufficient to explain why a treatment basin is consuming excess air. The plant has data; it may still lack the evidence needed to explain its losses. This is a meaningful competitive difference, not because every plant lacks analytics, but because an undetected loss can repeat on every shift. A site that can recognize the chemical or material change while it is developing may be able to investigate before the next batch is wasted, the next cleaning cycle runs long or the next treatment upset consumes hours of recovery. The urgency comes from the repetition of the loss—not from a claim that AI alone can fix it.
A new measurement layer changes what is possible
The most important signals are not always traditional equipment tags. In water-intensive processes, changing organic load, product carryover, cleaning-chemical breakthrough and contamination can be economically significant long before pressure, temperature or flow leave their normal ranges.
Optical measurements such as UV/visible absorbance can reveal changes in the spectral signature of a liquid stream. With appropriate application-specific calibration, spectral measurements can support estimates of parameters such as chemical oxygen demand; biochemical oxygen demand remains a laboratory-defined test and any real-time estimate is a surrogate, not a replacement for the reference method. Near-infrared and Raman methods may provide complementary information where the chemistry and measurement conditions support them. Fouling, matrix changes and calibration drift remain engineering constraints, not details to gloss over.
The opportunity is to combine this independent evidence with existing PLC, historian, laboratory and maintenance data. A physical change can then be interpreted in operational context: which valve changed, what batch was running, whether the upstream feed shifted, and whether the same pattern preceded a past upset.
What plant managers and controls engineers actually need to know
Consider a food or beverage facility that changes products several times per day. During each transition, valuable product may be diverted to drain until the line reaches specification. A flowmeter records the volume; it cannot, by itself, establish how much saleable material is in that flow. If a validated composition measurement identifies the transition sooner, the team can test whether it is safe to reduce diversion time. For illustration, recovering just $1,500 of material on four daily changeovers over 300 operating days would be worth $1.8 million annually. That is a scenario, not a measured result or a claim that every facility can recover it.
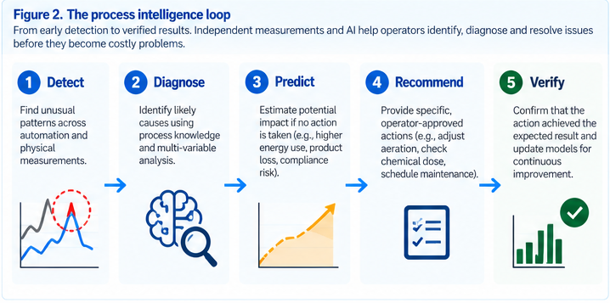
The same approach can target chemical overdosing, abnormal wastewater loading, cooling-water contamination and developing equipment problems. The workflow is specific: detect an unusual pattern across physical and automation signals; check instrument health; compare possible causes against process state, maintenance history and lab results; estimate the cost and risk of inaction; then give the operator a bounded recommendation. In high-consequence systems, the correct recommendation may be to collect another sample or inspect an instrument—not change a setpoint.
This last step matters. A recommendation without verification is only a hypothesis. Savings should be measured against a defensible baseline, with throughput, production mix, weather, water quality and other confounding variables accounted for where relevant.
The economics plant leadership will actually fund
The economics should start with the loss mechanism, not a generic percentage-savings promise. A facility losing $5,000 in recoverable product on each of 250 production days has $1.25 million in annual exposure. Recovering 20% would be worth $250,000 per year before implementation and operating costs. A separate line losing $40,000 in contribution margin during each of ten preventable process interruptions has $400,000 in annual exposure. These are illustrative business cases: whether the losses exist, are detectable, and can actually be prevented must be established from site data.
Energy remains important, but it is often only one line of the business case. Production yield, throughput, scrap, chemical use, cleaning time, discharge surcharges, maintenance and recovery labor may matter more. Avoid adding these categories together until overlaps are removed; for example, a lost batch and the associated downtime can represent the same economic event. The most persuasive project is one where an operator and finance team can agree on the baseline, the mechanism and the verified incremental result.
Deployment does not require surrendering control
The practical architecture starts read-only. Existing PLCs and safety systems remain in charge. Data can be acquired through approved industrial interfaces and historians, with network segmentation, access controls, time synchronization and clear data ownership. Independent sensing is added only where the available instrumentation cannot resolve the question. Models can first operate in shadow mode, showing what they would have detected and recommended without issuing commands.
Operators and engineers should define the initial use case, decision boundaries and success criteria. If the system cannot distinguish a real process change from an instrument fault, it should say so. If a recommendation cannot be tested safely, it should not be made operational. This is a pathway to greater autonomy, not an excuse to bypass established controls.
The next automation upgrade is a capability, not a control-system replacement
Industrial automation has already made equipment highly observable and controllable. The emerging shift is to make the physical process itself more observable: to relate what a machine is doing to what is happening to the water, chemistry or product moving through it. Continuous, calibrated measurements can provide new evidence; process-aware models can connect that evidence to likely causes and consequences; operators can act through existing procedures and controls. None of these steps is automatic or universal. Together, they make an increasingly compelling case for moving beyond alarms and retrospective reports.
For plant managers, the first question is where a repeatable loss is largest. For controls engineers, it is which signals are missing and how to integrate them safely. For process engineers, it is whether the measurement can be validated against the actual chemistry. For operations leaders, it is whether the recommendation is actionable during a shift. Plants that answer all four questions can build an advantage that a dashboard alone cannot deliver.
Sources and context: Siemens/Senseye, The True Cost of Downtime (2024), industry study of large enterprises; U.S. Energy Information Administration, 2022 Manufacturing Energy Consumption Survey (final tables released 2025–26). Figures describing plant opportunities are illustrative calculations, not measured outcomes.
Author note
Alexander Towfigh is founder of AquaMesh, which develops industrial process-intelligence software and spectral sensing technologies. The financial scenarios in this article are illustrative, not verified customer savings. Industry-wide downtime figures are sourced to Siemens/Senseye and should not be interpreted as savings achievable by a particular technology.


Electrical Engineer and business owner from the Nashville, Tennessee area. I also play music, Chess and Go.